Environmental Data
Energy
Contributing to the mitigation of global warming by reducing energy consumption and CO2 emissions at our business sites through ongoing facility upgrades and operational improvements
The amount of greenhouse gas emissions from all our sites in Japan is converted to a CO2 equivalent weight as shown below.
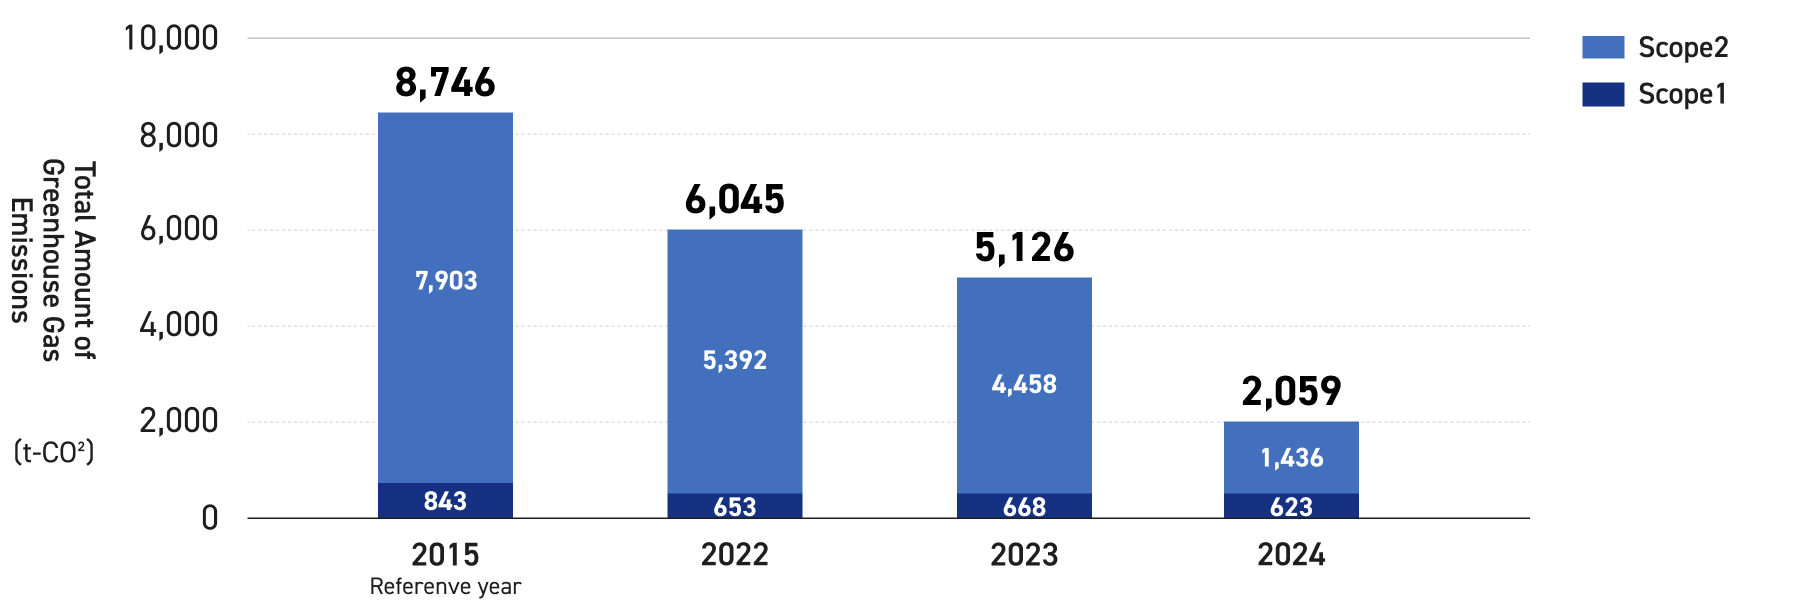
The above greenhouse gas emissions amount (t-CO2) is calculated by taking the total of the WRI/WBCSD GHG Protocol Scope 1 and Scope 2 emission amounts.
[Conversion factor]
Purchased electricity: Uses each electric company's conversion factor for the Act on the Rational Use of Energy report
Liquefied petroleum gas: 6.527 tons of CO2/1,000 ㎥, town gas: 2.23 tons of CO2/1,000 ㎥,
heat: 0.057 tons of CO2/GJ, gasoline: 2.29 tons of CO2/kL,
light oil: 2.62 tons of CO2/kL, kerosene: 2.5 tons of CO2/kL
Waste
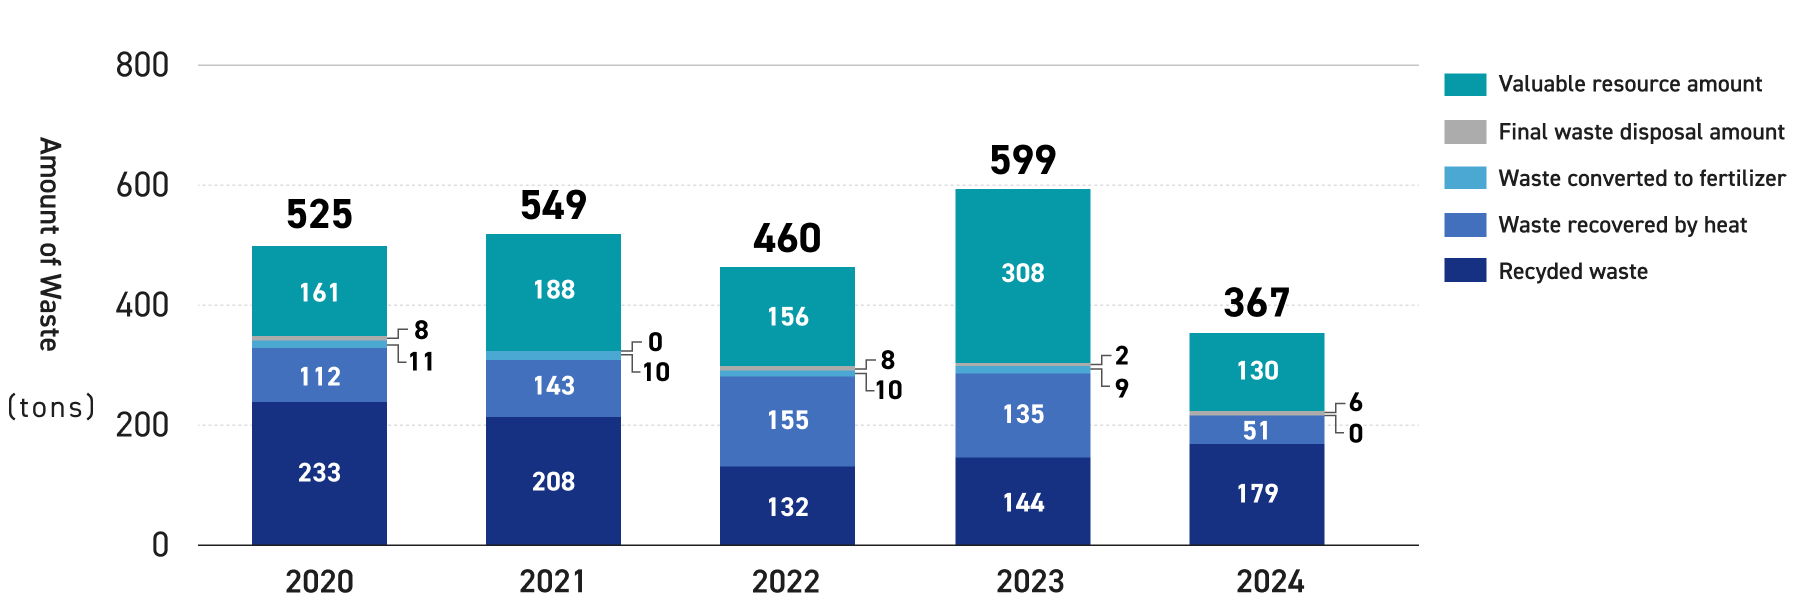
Contributing to the creation of a circular economy by achieving net zero industrial waste emissions
Amount of Waste
The total amount of waste generated at our business sites is as follows. We promote effective utilization through heat recovery, recycling, and other means at all office and factory sites.
We set a goal for 5% or more reduction in the amount of waste, down to 527 tons or less from the 555 ton average of fiscal years 2012 to 2014. Our actual results from fiscal 2024 were 236 tons (-57%).
Water
Appropriate management of water resource usage at business sites
Water Consumption Amount
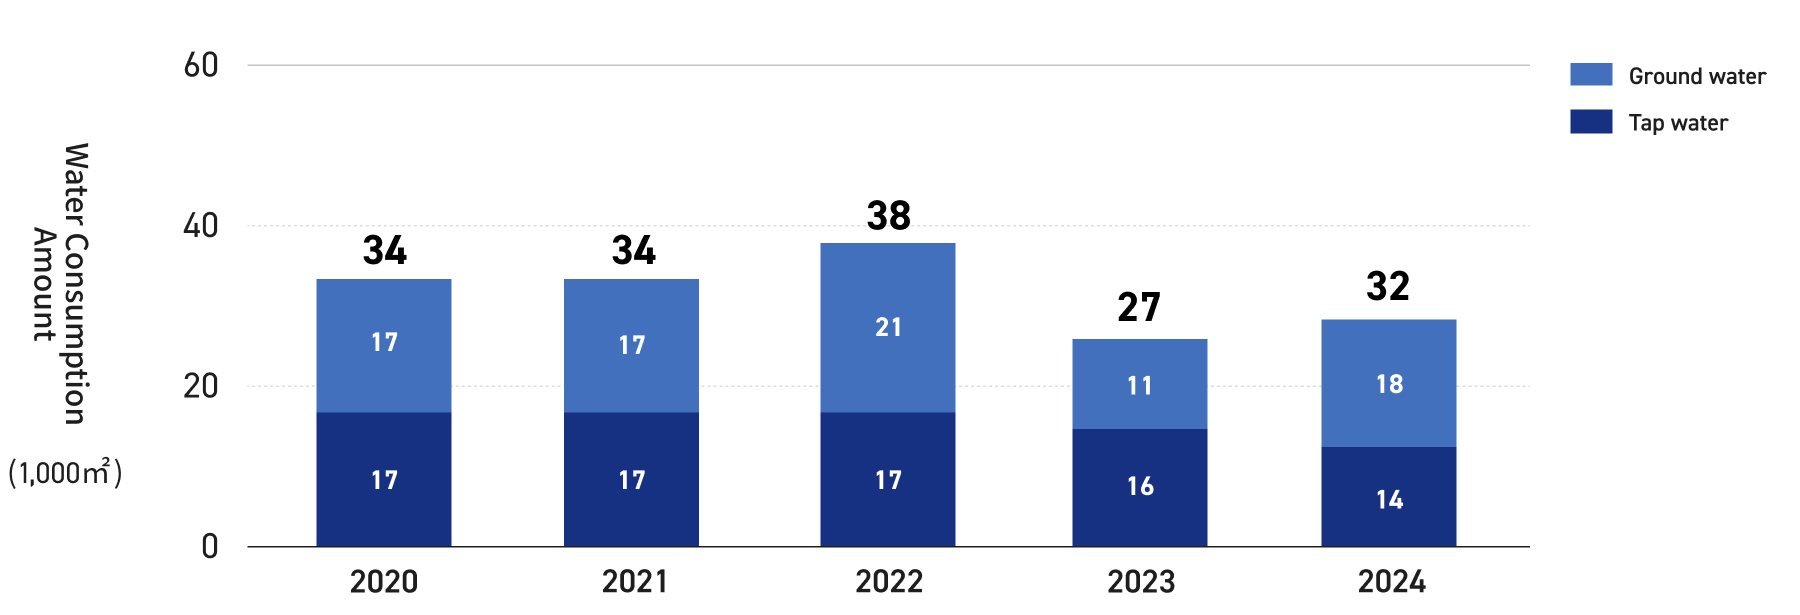
At each site, we use tap water for domestic use and to humidify the office in winter. At our Headquarters, we use ground water to water our plants in summer, and at our Headquarters and the ProDeS Center, we use ground water to melt snow. We use water for our every day needs at our company sites, not for industrial purposes.
For our total water consumption amount, we set a target to reduce it by 1% or more to an amount of 35,600㎥ or less compared to the reference year of 2018. In fiscal 2024, we achieved our target with a result of 32,000 ㎥ (a 10% reduction). Snowfall was heavier than in the previous fiscal year, resulting in increased use of groundwater (for snow melting).
Our water is used for every day purposes. We do not have any water that can be reused or recycled.
Water Drainage Amount
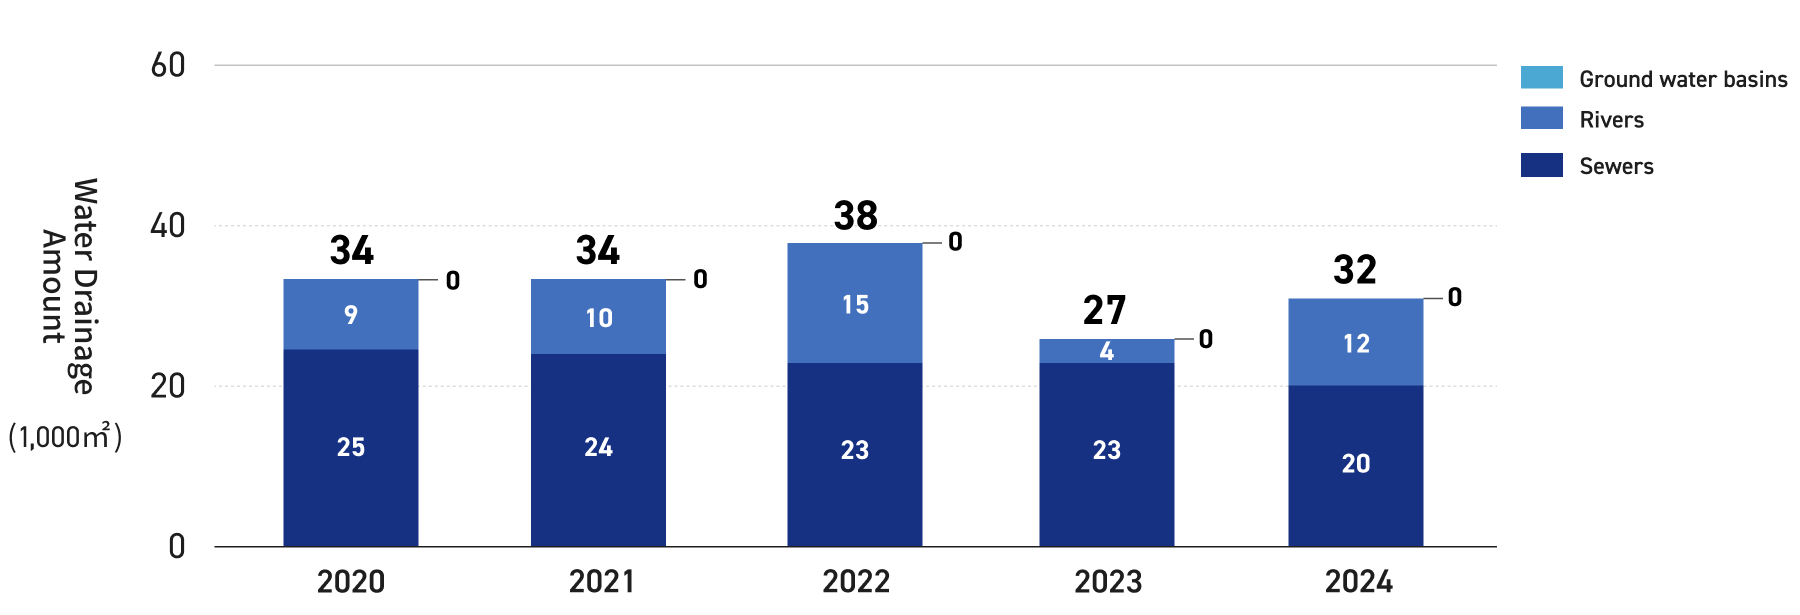
Tap water used for domestic uses drains into the sewer. Ground water used to melt snow drains into the rivers, and water used to water plants drains underground. We have been continuously monitoring and measuring water quality by using our own self management values in order to ensure the quality of water that drains from our main sites.
In fiscal 2024, the amount of groundwater used for snowmelt increased, resulting in an increase in the amount of water discharged into rivers.
Chemical Substances
Appropriate management of the volume of chemical substances used in business activities
Results in Handling of Chemical Substances
We tally the amount of chemical substances that are used for purposes such as designing, developing, evaluating, manufacturing, maintaining, or cleaning up the premises no matter how much there is.
Chemical Substances Subject to PRTR Law
The amount of chemical substances subject to the PRTR law that were handled in fiscal 2024 is shown below. None of the chemical substances were in excess of the annual values which require the relevant prefectural authorities to be notified (*1).
We set a goal to limit the amount we handle to less than the average of fiscal years 2012 to 2014, which was 0.132 tons. Results for fiscal 2024 were 0.165 tons (up 25.0%) due to measures such as promoting the disposal of unnecessary solder (lead compounds).
Annual Handled Amount of Chemical Substances Subject to the PRTR Law (Class I Specified Chemical Substances)
| Chemical Substance Name | Fiscal 2020 | Fiscal 2021 | Fiscal 2022 | Fiscal 2023 | Fiscal 2024 |
|---|---|---|---|---|---|
| n-Alkylbenzenesulfonic acid and its salts | 0.044 | 0.031 | 0.031 | 0.036 | 0.034 |
| 2-aminoethanol | 0.027 | 0.025 | 0.019 | 0.025 | 0.027 |
| Poly(oxyethylene) alkyl ether | 0.025 | 0.021 | 0.023 | 0.026 | 0.019 |
| N,N-Bis(2-hydroxyethyl)alkanamide (*2) | - | - | - | 0.017 | 0.017 |
| Silver and its water-soluble compounds | 0.031 | 0.022 | 0.019 | 0.012 | 0.013 |
| Lead and itscompounds | 0.000 | 0.000 | 0.000 | 0.000 | 0.012 |
| Other | 0.009 | 0.008 | 0.007 | 0.023 | 0.043 |
| Total | 0.136 | 0.107 | 0.098 | 0.140 | 0.165 |
VOC (Volatile Organic Compound)
Although there are no specific facilities that are subject to VOC emission control, we make an independent effort to maintain and manage the amount of VOCs handled.
We set a goal to limit the amount we handle to less than the average of fiscal years 2012 to 2014, which was 1.266 tons. Our actual results for fiscal 2024 increased due to the inclusion of ethanol used in cleaning and disinfection agents. However, the overall volume was reduced to 0.905 tons, achieving a 28.5% decrease and meeting the target.
Annual Amount of VOC Handled
| Chemical Substance Name | Fiscal 2020 | Fiscal 2021 | Fiscal 2022 | Fiscal 2023 | Fiscal 2024 |
|---|---|---|---|---|---|
| Isopropyl alcohol | 0.790 | 0.809 | 0.465 | 0.360 | 0.346 |
| Butyl acetate | 0.046 | 0.058 | 0.074 | 0.040 | 0.046 |
| Ethanol | 0.097 | 0.053 | 0.052 | 0.110 | 0.484 |
| Other | 0.017 | 0.018 | 0.023 | 0.014 | 0.028 |
| Total | 0.950 | 0.938 | 0.614 | 0.524 | 0.905 |
Greenhouse Gases
The amount of greenhouse gases that were handled in fiscal 2024 is shown below. The annual amount handled in fiscal 2024 is converted to a CO2 equivalent weight of approximately 8 tons.
Our reduction target for the amount (tons) of greenhouse gas emissions handled applies to reduction at all our sites.
Annual amount of greenhouse gases handled (Converted to CO2)
| Chemical Substance Name | Fiscal 2020 | Fiscal 2021 | Fiscal 2022 | Fiscal 2023 | Fiscal 2024 |
|---|---|---|---|---|---|
| 1,1,1,2-tetrafluoroethane (HFC-134a) | 11.517 | 7.061 | 6.155 | 4.119 | 7.669 |
| 1,1-Difluoroethane (HFC-152a) | 0.054 | 0.059 | 0.233 | 0.107 | 0.000 |
| CO2 | 0.001 | 0.000 | 0.000 | 0.020 | 0.005 |
| Total | 11.572 | 7.120 | 6.388 | 4.246 | 7.674 |